Spectrum analysis can be a confusing topic. Especially if you’re only starting out in music production! It sure used to confuse me. This article explores five different ways of how to use a spectrum analyzer in the music production, mixing and mastering processes. This article is updated in 2019.
Spectrum analysis is a double-edged sword
Before we go into how to actually use spectrum analysis, I want to point out something very important.
The process of making music has become more visual in past times. There have been huge developments in computing power, screen technology, and software. We’re being treated with ultra-precise visual feedback of most things inside a DAW now.
It’s a double-edged sword! Why? In my mind there are three things contributing to it:
- We are very visual creatures by nature. Plus we have a natural bias for shiny new things. We tend to prioritize our vision over other senses. Subconsciously, we prefer to ground our trust and decisions on what we see.
- Our brain has
limited processing power. We are only good at focusing on one thing at a time. If you’re allocating most of your internal CPU on looking, you’re not listening as well as you could. That is how our brain works. - In reality, sound (and especially music) is always a lot more complex than any visual representation of it. We are getting fooled by the fireworks. Visual feedback doesn’t represent the emotional content of your music at all.
Here’s the punchline guys:
Don’t make music with your eyes.
You should only use visual feedback:
- As a supporting tool to confirm what you hear (or don’t hear).
- To spot possible problems.
Be tactical.
Using a spectrum analyzer in music production, mixing and mastering
Now that the important basic premise is established, we can go deeper into the why, when and how to use audio spectrum analysis. There are several situations where spectrum analysis can be extremely helpful.
The slope setting
Before you start working with an audio spectrum analyzer, you should familiarize yourself with the concept of slope. The slope (also sometimes called Tilt) is a setting that can be found in most spectrum analyzers. It defines how steeply the analysis curve falls per octave. Depending on how the slope setting is set, the display of the analyzer can look quite different.
A slope setting of -3 dB per octave matches pink noise and aims to represents sound the way our hearing works. A slope setting of -4.5 dB is also quite common. These settings usually work well for judging things in full range – complete songs, for instance.
But let’s say you’re looking at a specific range. Maybe you want to know how even the different notes are in your sub-bass track. A sloped setting will skew the visuals and make it hard to judge. In this type of situation, you’re better of setting the slope at zero. This gives you accurate metering.
Keep this in mind while you are working! Now, let’s look at four different use cases of spectrum analysis in music production, mixing and mastering.
1. Revealing problems on individual channels and instruments
This is the #1 thing that I use a spectrum analyzer for. I don’t always trust my ears completely, and my listening environment isn’t perfect. So spectrum analysis is a great help for indicating potential problems.
Here are the most common in-the-mix analysis situations for me:
- Checking every channel for unnecessary
low-end content (rumble or hum). - Checking bass instruments for notes that are unintentionally louder or quieter than others.
- Identifying the exact frequencies of unwanted resonances or peaks. (I then deal with them using a good surgical EQ – this is what I use.)
- Identifying over- or under-pronounced high end. Normally I should be hearing this too, but in long sessions, we get used to hearing things a certain way. Be careful of ear fatigue! Constant referencing also helps here.
Example (problems in a vocal recording):
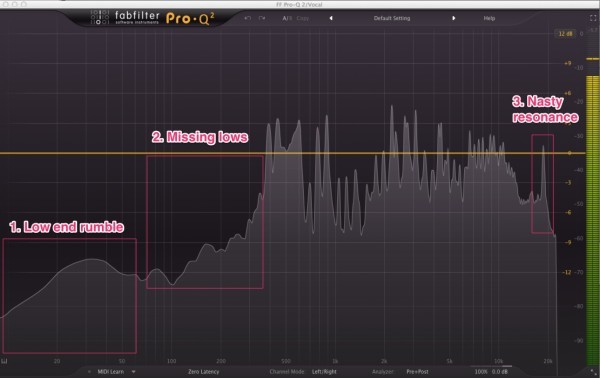
Pictured above is a screen capture of a vocal sound with three problems.
- The hum/rumble in the low end is clogging up the mix.
- The vocal sound is possibly missing some bottom end (of course this could be on purpose). You should be able to hear this without looking at the spectrum, too.
- There is a nasty resonant peak in the top end near 20 kHz. This peak is unrelated to the natural resonances of the voice that you can see in the 500 Hz-10 kHz range. The response should be rolling off neatly towards the high end.
2. Working with poor acoustics
There are a few fortunate people out there who get to work in perfectly tuned studios. If you’re one of them, congratulations! As for the rest of us, we have to deal with less than ideal room acoustics – sometimes even ambient noise. Spectrum analysis can help us in dealing with this issue.
It’s fairly easy to improve the acoustics of an untreated room noticeably, but that will only take you so far. Most often the hardest thing to deal with is an uneven bass response in the room. This is caused by the accumulation of so-called standing waves between the walls, the roof,
Low-frequency sound waves cancel each other out at places and accumulate at others. You can hear this as the bass gets louder or quieter when you move around. How bad it gets depends on several things:
- Dimensions of the room (smaller is usually worse).
- Building materials (wood is good, concrete/stone is terrible).
- Your playback system and how it works with your room.
- The listening position.
Standing waves are difficult to kill. The usual acoustic panels won’t help with low frequencies. It usually takes a lot of measuring and well designed heavy duty bass trapping to get the low end under control. Standing waves can become anything from a minor nuisance to a major headache (more likely).
So long story short: standing waves cause you to hear some of the bass frequencies louder or quieter than they really are. The peaks/dips can sometimes be up to 30dB! You can imagine how that can completely screw up what you are hearing. It causes you to make poor judgments as you try to compensate by boosting/attenuating the bass in your mix.
Don’t panic
Now, does it mean you are unable to get a good mix in a room with an uneven bass response? Not at all!
First, the better you know your monitoring environment, the better you will mix in it. The more you work in an environment, the better adjusted your hearing will become to it. Measuring a room’s frequency response also helps a great deal. Get the data if you can (but make sure you do it right).
Second, spectrum analysis can be a great help. A spectrum analyzer shows what’s really going on. You’ll know if a particular note/frequency is louder/quieter than others, or whether it’s your room playing tricks on you.
3. Working with less than ideal monitoring
Most near field monitors do not reproduce the lowest end of the spectrum at all. Depending on the speaker, the low end usually begins to fade out anywhere from about 90 to 50 Hz. You get gradually less and less bass as you go lower on the frequency spectrum. And even if your monitors do go pretty low, they might not be very accurate in the lowest end.
The way around this is to use a properly tuned subwoofer with your nearfield monitors. But that is not always possible. Again, the spectrum analyzer is your friend.
Fire up your spectrum analyzer every now and then to have a look at what is going on in the lowest end of your mix. You might be surprised to find rumble and noise that your monitors are not reproducing. This can especially happen with any live recordings.
4. Referencing
Warning: We are approaching territory that can be very deceiving. What could that be? Using spectrum analysis for comparing a reference mix to your own.
Don’t jump to conclusions
Try not to jump to conclusions when comparing the spectrum graphs of two different songs. Don’t think you can make your song sound the same as the reference track by trying to make the spectrums identical. Music is more complicated than that. You have to listen and understand what is going on under the hood in both tracks. The visual feedback can only point you in the right direction at best.
Consider the entire dynamic chain of events happening in the mix. What’s the reasoning the person behind the reference mix had when they made those choices?
If your reference music is mastered you have to take that into account as well. The dynamics and loudness can be very different from your raw mix.
How to use a spectrum analyzer in referencing
In conjunction with careful listening, visual referencing can shed light on many issues. It will also help you stay consistent. It is also a great learning tool!
When referencing, it’s important to choose a track that not only sounds great. You should also use reference material you know well.
Try to always use the same reference songs. This way their individual characteristics become a part of your internal map. It makes comparing your own material to them much easier in the long run.
In a referencing situation, it often helps to set the spectrum response to a fairly slow speed. This displays an average reading over a few seconds. This gives you a more balanced behavior and a better overview of what is going on.
What to look for in the spectrum graph?
Here are a few things that I often look/listen for when referencing:
- Is the frequency response balanced? I am always especially concerned about the level of bass. Note: balanced here does not necessarily mean even. It’s quite normal to have the high end of the mix gradually roll off, for example. It depends on how the analyzer you are using is calibrated (look for a setting called “slope” or “tilt”).
- Are there any obvious gaps or peaks in the spectrum? If so, why? It could be for a good reason, or there could be a problem.
- Is the snare/kick punching through enough?
- How do the Mid and Side spectrums compare? I generally try to avoid getting Side content in the lowest end of the spectrum, for example.
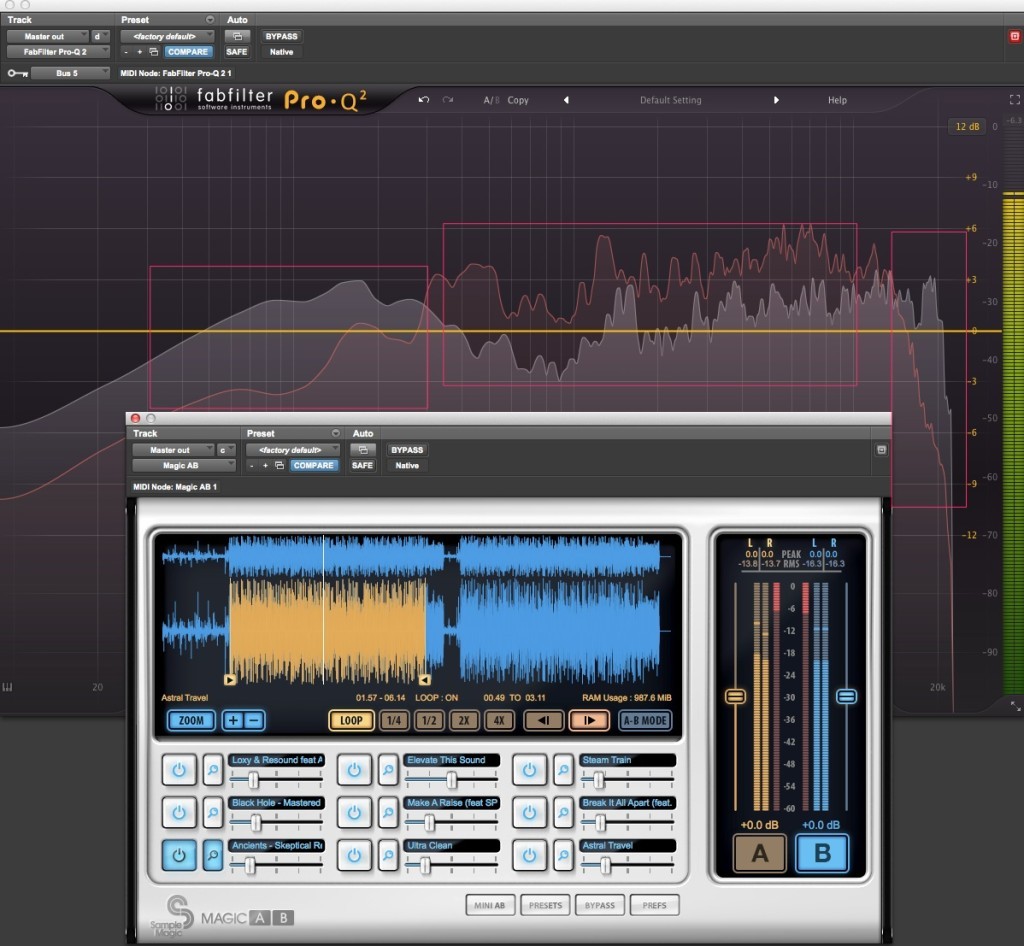
Pictured above I am comparing my mix to some reference mixes I have running from the Magic AB plugin. (Update 2019: I am now using the newer Metric AB plugin which has built-in analysis tools). Fabfilter Pro-Q3 is set to show the original in the red (via sidechain) and the reference mix in the grey graph.
I see three areas calling for further investigation:
- The sub-bass is almost 6 dB louder in the reference mix.
- The mid/mid-high range is louder in my mix.
- The reference mix has more top end. The top-end on my mix resembles a roll-off you would get on vinyl. That isn’t necessarily bad – just different.
Please note that in reality, you should never compare static snapshots. Instead, see how the spectrums behave live. A loud snare or sub-bass hit can drastically alter the curve from one moment to another, for example.
Match loudness
It is also extremely important to match the levels of the two tracks as close as possible. A loudness meter can help there (I recommend using an LUFS one), but always use your ears to adjust.
Look at the example picture above to illustrate this. After matching levels by ear the reference mix (B) is showing less RMS than the track I’m working on (A). This is because the reference track is a very loud mix and has been mastered so I’ve had to bring it down quite a bit. The frequency balance of the two mixes is also different. This affects how the RMS meter behaves, too. The RMS readings are different, but judging by ear, the two are playing back at roughly the same level.
5. Measuring room & loudspeaker frequency response
You can use spectrum analysis to help reveal the real frequency response of your listening environment. You may not like the results! It’s very common to have large bumps and gaps in the low-frequency response.
You can use a donationware application called Room EQ Wizard for measuring. It’s available for PC, Mac and Linux. You’ll also need an SPL meter that has been calibrated for REW. REW comes with calibration files for some common and affordable SPL meters.
REW will guide you through the measurement process. The basic idea is very simple – a controlled sine wave sweep from 0 Hz to 20 kHz is played through your speakers and the SPL meter records the sound pressure level at different frequencies. REW will then create visual data that reveals the frequency response of your room in all its g(l)ory.
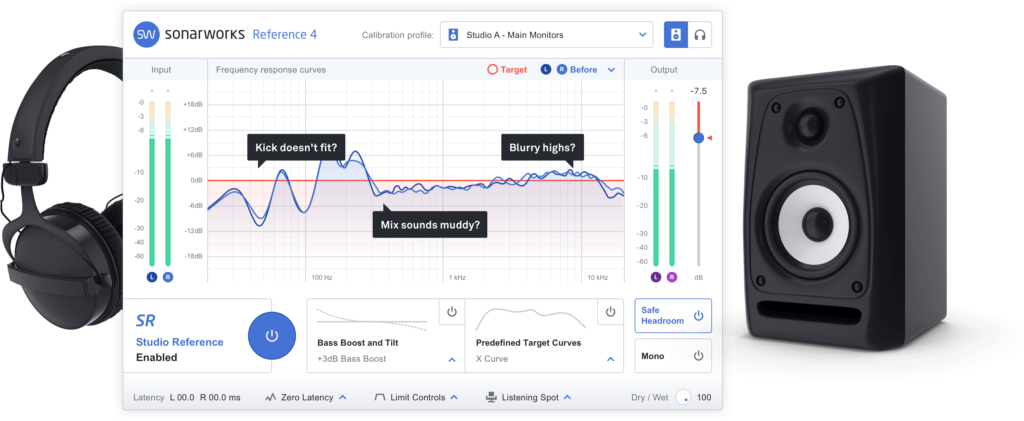
There’s also software called Sonarworks, which measures your room response and also corrects the output of your speakers. I’ve been using it for the past 3 years and I love it. It helps even out the gaps and bumps in my room.
You can get some indication of your room’s response by simply playing a sine wave sweep and listening for peaks and dips in loudness. Check out this post for a sweep you can play and more: Achieve a Good Low End and Sub-Bass in Your Mix.
Spectrum analyzer software
Here’s some audio spectrum analyzer software and a couple of other tools that I can recommend.
FabFilter Pro-Q3
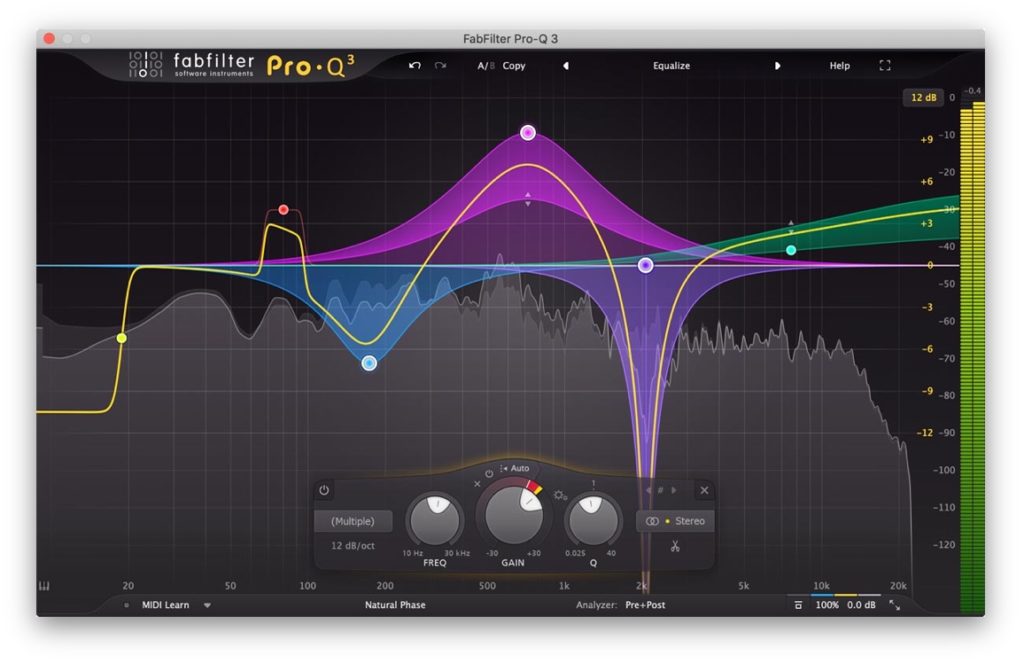
I use this plugin both as a spectrum analyzer and an EQ. I love the clean and large analyzer display. It’s easy to zoom in and out of the spectrum. You can even make it full screen.
The fantastic EQ functions of the Pro-Q3 are a different topic altogether. But I have to mention two in this context:
- The Spectrum Grab allows you to grab peaks of the spectrum and pull them up or down to create EQ nodes. I love this workflow. Great for killing resonances quickly.
iZotope Insight
This is the holy grail of visual metering. Insight offers all the metering options you could hope for and more!
Voxengo Span
This is a great free spectrum analyzer. It is very configurable to your specific needs and tastes. Span also has a loudness meter that can display dynamic range. Turn on the Density mode in the settings to see it.
Metric AB
This plugin has made referencing so much easier for me. It allows you to load up to 16 reference tracks at a time. It’s very quick to do A/B referencing between them and your mix. And it has a fantastic set of analysis tools built right in.
I always have Metric AB sitting on my mix bus. This allows me to also inspect the spectrum of my reference material and compare
Room EQ Wizard
REW has been a great help in figuring out the frequency response in my studio rooms for almost a decade now.
It’s donationware. If you have not measured the frequency response of your workspace yet, you should definitely get to it.
How are you using spectrum analysis?
Any questions? Is there something I’m missing? How are you using spectrum analyzers when making music?
I would love to hear your thoughts. Let me know in the comments.
Leave a Reply